Delivering more actionable and strategically valuable research, The Business Research Company’s 2026 market reports feature market attractiveness analysis, total addressable market evaluation, company benchmarking matrices, interactive Excel dashboards, expanded supply chain intelligence, emerging startup coverage, and detailed product insights.
Reverse-Logistics Sorting-Display Market Size Forecast: How Large Could The Market Become By 2030?
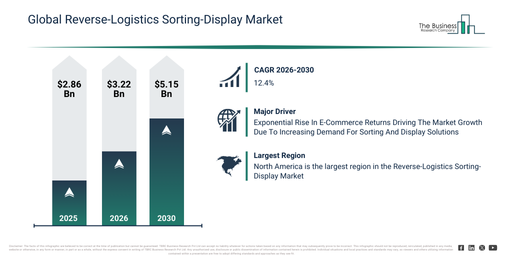
The reverse-logistics sorting-display market size has experienced rapid expansion in recent years. It is projected to climb from $2.86 billion in 2025 to $3.22 billion in 2026, achieving a compound annual growth rate (CAGR) of 12.7%. The market’s growth during the historical period can be attributed to the expansion of e-commerce return volumes, a rise in omnichannel retail operations, increasing emphasis on resale and refurbishment, the adoption of barcode and tracking systems, and the rising complexity of return workflows.
The reverse-logistics sorting-display market size is projected for swift expansion in the coming years. This market is predicted to reach $5.15 billion by 2030, exhibiting a compound annual growth rate (CAGR) of 12.4%. Factors contributing to this growth during the projected timeframe include increasing investments in circular economy logistics, a rise in the use of AI-assisted returns processing, the expansion of automated reverse logistics facilities, an enhanced emphasis on recovering costs from returned merchandise, and a greater need for real-time return transparency. Key developments anticipated within this period involve the increasing embrace of structured return classification systems, a growing deployment of automated sorting and display interfaces, the expanding incorporation of condition-based routing logic, the proliferation of centralized reverse logistics hubs, and an elevated focus on minimizing errors in returns handling.
Download A Free Sample Report For Comprehensive Market Insights:
Reverse-Logistics Sorting-Display Market Industry Drivers: What Is Driving Revenue Growth?
The significant increase in e-commerce returns is anticipated to stimulate the expansion of the reverse-logistics sorting-display market in the future. E-commerce returns are defined as products purchased online that customers send back to retailers for reasons such as incorrect sizing, defects, or general dissatisfaction. The growth of online shopping is driving this rise in e-commerce returns, as a higher volume of digital transactions results in more merchandise being returned and needing processing. Reverse-logistics sorting-display systems assist in managing e-commerce returns by streamlining the classification and organization of returned items, which facilitates quicker processing, lowers operational costs, improves inventory management, and ultimately boosts customer satisfaction through faster refunds or exchanges. For example, in December 2024, data from the National Retail Federation, a US-based retail industry trade association, indicated that total retail returns climbed from $816 billion in 2022 to an estimated $890 billion in 2024, showcasing a substantial increase in returned goods. Therefore, the rapid rise in e-commerce returns is a primary driver for the growth of the reverse-logistics sorting-display market. The growing focus on sustainability and circular economy practices is projected to boost the reverse-logistics sorting-display market’s growth moving forward. Sustainability and circular economy practices refer to structured approaches that prioritize resource efficiency, waste reduction, and material reuse to minimize environmental impact. This increasing emphasis on sustainability is a result of stricter environmental regulations, as governments implement binding targets and policies to transition from linear ‘take-make-dispose’ models to circular economic systems. The heightened focus on sustainability and circular economy practices encourages the adoption of reverse-logistics sorting-display systems by providing incentives for businesses to efficiently recover, sort, and repurpose returned or end-of-life products. This ultimately reduces waste, decreases resource consumption, and establishes closed-loop supply chains that align environmental responsibility with operational efficiency. For instance, in November 2024, the London Borough of Hounslow, a UK-based local government authority responsible for environmental and waste management services, reported a 5% increase in recycling levels between October 2022 and September 2023. Consequently, the increasing emphasis on sustainability and circular economy practices is driving the expansion of the reverse-logistics sorting-display market.
Reverse-Logistics Sorting-Display Market Segments: Where Are The Largest Growth Opportunities?
The reverse-logistics sorting-display market covered in this report is segmented –
1) By Component: Services, Hardware, Software
2) By Sorting Technology: Semi-Automated Sorting, Automated Sorting, Manual Sorting
3) By Application: Pharmaceuticals, E-commerce, Retail, Automotive, Electronics
4) By End-User: Retailers, Third-Party Logistics Providers, Manufacturers
Subsegments:
1) By Services: Transportation Services, Warehousing Services, Inventory Management Services, Packaging Services, Other Service Types
2) By Hardware: Sorting Equipment, Conveyor Systems, Barcode Scanners, Storage Racks
3) By Software: Inventory Management Software, Tracking And Monitoring Software, Route Optimization Software, Logistics Management Software
Reverse-Logistics Sorting-Display Market Major Participants And Competitive Dynamics
Major companies operating in the reverse-logistics sorting-display market are FedEx Corporation, United Parcel Service Inc., Deutsche Post AG (DHL Supply Chain), XPO Logistics Inc., C.H. Robinson Worldwide Inc., Ryder System Inc., GEODIS SA, ALOM Technologies Inc., Kuehne + Nagel International AG, CEVA Logistics AG, Reverse Logistics Group Inc. (RLG), Hollingsworth & Vose Company, Iron Mountain Incorporated, B-Stock Solutions Inc., Optoro Inc., Inmar Intelligence Inc., ReturnLogic Inc., GXO Logistics Inc., LiquiDonate Inc., Productiv Inc.
Access The Complete Reverse-Logistics Sorting-Display Market Report:
Reverse-Logistics Sorting-Display Market Leading Geography: Which Region Generates The Most Revenue?
North America was the largest region in the reverse-logistics sorting-display market in 2025. Asia-Pacific is expected to be the fastest-growing region in the forecast period. The regions covered in the reverse-logistics sorting-display market report are Asia-Pacific, South East Asia, Western Europe, Eastern Europe, North America, South America, Middle East, Africa.
Get in touch with us:
The Business Research Company: https://www.thebusinessresearchcompany.com/
Americas: +1 310-496-7795
Asia: +44 7882 955267 & +91 8897263534
Europe: +44 7882 955267
Email us at: marketing@tbrc.info
Follow us on:
LinkedIn: https://in.linkedin.com/company/the-business-research-company
YouTube: https://www.youtube.com/channel/UC24_fI0rV8cR5DxlCpgmyFQ
Global Market Model: https://www.thebusinessresearchcompany.com/global-market-model

Wasay has over a decade of experience in market research, data modelling, and analytics, with prior experience at GlobalData and Decision Tree Consulting Services. At The Business Research Company , he leads research operations across syndicated studies, customized consulting engagements, and the Global Market Model platform. His professional experience includes supporting organizations such as Boston Consulting Group, KPMG, and Ernst & Young. Wasay holds a degree in Electronics and Communications Engineering, postgraduate management qualifications from International Management Institute Belgium and Indian School of Business and Entrepreneurship, and completed the Integrated Program in Business Analytics from Indian Institute of Management Indore.