Backed by market attractiveness analysis, total addressable market sizing, company benchmarking matrices, interactive Excel dashboards, wider supply chain intelligence, emerging startup coverage, and detailed product-level insights, The Business Research Company’s 2026 market reports are designed to offer research that is more actionable and strategically valuable than ever.
Port Digital-Twin Visualization Market Revenue Outlook: What CAGR Lies Ahead Through 2030?
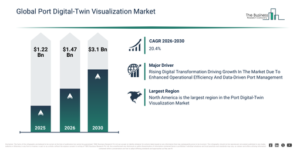
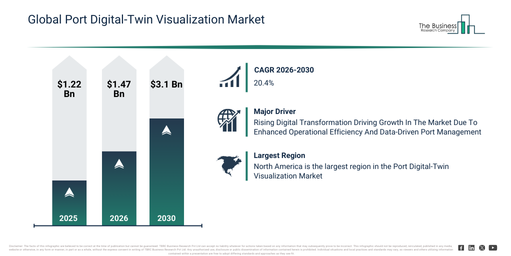
The port digital-twin visualization market has witnessed significant expansion in recent years. This market is set to grow from $1.22 billion in 2025 to $1.47 billion in 2026, exhibiting a compound annual growth rate (CAGR) of 20.7%. Historically, this expansion has been propelled by factors such as the increase in global port infrastructure projects, the growing implementation of port automation systems, the wider adoption of IoT devices in ports, the demand for improved operational insights, and an upsurge in maritime trade volumes.
The port digital-twin visualization market is poised for significant expansion over the forthcoming years. It is projected to reach $3.1 billion by 2030, exhibiting a compound annual growth rate (CAGR) of 20.4%. This anticipated growth during the forecast period is largely driven by increasing investments in smart port initiatives, a rising demand for predictive and prescriptive analytics, the expansion of cloud-native port platforms, a growing focus on operational resilience, and the integration of AI-driven optimization models. Concurrently, major trends in the same period encompass the increasing adoption of real-time port simulation platforms, the expanding integration of sensor-driven visualization systems, a rising use of predictive analytics for port operations, the spread of cloud-based digital twin deployments, and a stronger emphasis on 3D and immersive port visualization.
Get A Free Sample Report With In-Depth Market Insights:
Port Digital-Twin Visualization Market Growth Backed By Core Demand Fundamentals
The ongoing expansion of digital transformation is projected to stimulate the growth of the port digital-twin visualization market. Digital transformation involves the fundamental alteration of an organization’s operations and value delivery through the adoption of digital technologies. Its pace is quickening due to its capacity to enhance operational efficiency through process automation, error minimization, and optimized resource utilization. Port digital-twin visualization facilitates this shift by creating a real-time virtual representation of port activities, thereby enabling data-informed decision-making, streamlining workflows, and boosting efficiency, safety, and resource management. An illustration of this is from November 2023, where the Central Digital and Data Office, a UK governmental entity focused on digital innovation, reported that an analysis in 2022 indicated government digital transformation could generate over $1.17 billion in savings by eliminating paper-based expenses. Furthermore, by 2025, a competitive digital remuneration framework is anticipated to save $122.12 million annually, by reducing attrition rates and lessening dependence on expensive labor. Consequently, the rising digital transformation is a key driver for the port digital-twin visualization market’s expansion.
Port Digital-Twin Visualization Market Segment Analysis Spotlighting Growth Areas
The port digital-twin visualization market covered in this report is segmented –
1) By Component: Software, Hardware, Services
2) By Deployment Mode: On-Premises, Cloud
3) By Application: Port Operations Optimization, Asset Management, Predictive Maintenance, Safety And Security, Other Applications
4) By End-User: Container Terminals, Bulk Terminals, Oil And Gas Terminals, Other End Users
Subsegments:
1) By Software: Simulation Platforms, Data Analytics Tools, Visualization Interfaces
2) By Hardware: Sensors, Cameras, Networking Devices
3) By Services: Consulting Services, Implementation Services, Maintenance And Support Services
Port Digital-Twin Visualization Market Growth Trends Reshaping The Competitive Landscape
Leading companies active in the port digital-twin visualization market are prioritizing the development of innovative solutions, such as predictive analytics, to enhance port operations, boost efficiency, and reduce operational expenditures. Predictive analytics refers to the application of historical data, statistical algorithms, and machine learning methods to forecast future outcomes and trends. For instance, in March 2025, the Maritime and Port Authority of Singapore, a Singapore-based government agency, launched its initial maritime digital twin to construct a real-time, virtual representation of its port and maritime activities for improved oversight, effectiveness, and decision-making. This creates a real-time virtual replica of its port, thereby improving operational efficiency, safety, and sustainability. It enables real-time observation, predictive maintenance, and scenario simulations to optimize port logistics and minimize emissions. The purpose is to support more intelligent decision-making, innovate maritime operations, and maintain Singapore’s leadership as a global maritime hub.
Port Digital-Twin Visualization Market Leading Companies: Who Holds The Strongest Market Presence?
Major companies operating in the port digital-twin visualization market are Siemens AG, ABB Ltd, Jacobs Solutions Inc., Wärtsilä Corporation, Hexagon AB, Autodesk Inc., DNV Group, Environmental Systems Research Institute Inc., Bentley Systems Incorporated, Kongsberg Digital AS, Cognite AS, Tideworks Technology Inc., NavVis GmbH, Hamburg Port Consulting GmbH, DBiz.ai, Desapex, Teqplay GmbH, MaxWhere B.V., Twinzo GmbH, Unity Technologies SF Inc.
View The Full Port Digital-Twin Visualization Market Report:
Port Digital-Twin Visualization Market Regional Analysis And Top Geography
North America was the largest region in the port digital-twin visualization market in 2025. Asia-Pacific is expected to be the fastest-growing region in the forecast period. The regions covered in the port digital-twin visualization market report are Asia-Pacific, South East Asia, Western Europe, Eastern Europe, North America, South America, Middle East, Africa.
Reach Out To Our Team:
The Business Research Company: https://www.thebusinessresearchcompany.com/
Americas: +1 310-496-7795
Asia: +44 7882 955267 & +91 8897263534
Europe: +44 7882 955267
Email us at: marketing@tbrc.info
Follow us on:
LinkedIn: https://in.linkedin.com/company/the-business-research-company
YouTube: https://www.youtube.com/channel/UC24_fI0rV8cR5DxlCpgmyFQ
Global Market Model: https://www.thebusinessresearchcompany.com/global-market-model

Wasay has over a decade of experience in market research, data modelling, and analytics, with prior experience at GlobalData and Decision Tree Consulting Services. At The Business Research Company , he leads research operations across syndicated studies, customized consulting engagements, and the Global Market Model platform. His professional experience includes supporting organizations such as Boston Consulting Group, KPMG, and Ernst & Young. Wasay holds a degree in Electronics and Communications Engineering, postgraduate management qualifications from International Management Institute Belgium and Indian School of Business and Entrepreneurship, and completed the Integrated Program in Business Analytics from Indian Institute of Management Indore.