Designed to make market research more actionable and strategically valuable, The Business Research Company’s 2026 market reports feature market attractiveness scoring, total addressable market sizing, company benchmarking matrices, interactive Excel dashboards, deeper supply chain intelligence, emerging startup tracking, and granular product-level insights.
How Fast Is The Data Visualization Tools Market Growing? Market Size, CAGR And Forecast Insights
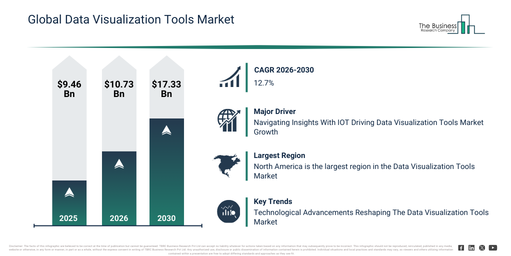
The data visualization tools market has experienced significant expansion in recent years. Projections indicate it will expand from $9.46 billion in 2025 to $10.73 billion in 2026, demonstrating a compound annual growth rate (CAGR) of 13.3%. Historically, this growth has been driven by several factors, including the rising volumes of enterprise data generation, the widespread adoption of business intelligence platforms, the increasing emphasis on data-driven decision-making, the expanding requirements for enterprise reporting, and the growing integration of dashboards across various business functions.
The data visualization tools market is projected to experience substantial expansion in the coming years, reaching $17.33 billion by 2030, with a compound annual growth rate (CAGR) of 12.7%. This growth over the forecast period is primarily driven by factors such as the increasing embrace of augmented analytics, a heightened demand for embedded analytics solutions, the proliferation of cloud-native data platforms, expanded application of visualization in AI-driven insights, and a stronger emphasis on predictive and prescriptive analytics. Key trends anticipated during this period encompass the wider acceptance of self-service visualization tools, an escalating need for real-time interactive dashboards, increased integration with sophisticated analytics platforms, the broadening of cloud-based visualization options, and an elevated commitment to data storytelling features.
Unlock Data Visualization Tools Market Insights With A Free Sample Report:
Data Visualization Tools Market Momentum: Key Driver Expected To Boost Growth Through 2030
The escalating demand for IoT devices is anticipated to drive the future expansion of the data visualization tools market. Internet of Things devices, or IoT devices, are defined as physical objects or tools equipped with sensors, software, and connectivity features that allow them to gather, exchange, and transmit data via the internet. These IoT devices supply valuable data to Data Visualization Tools, empowering organizations to extract insights, make informed strategic decisions, and streamline operations across various sectors. The integration of data generated by IoT devices with visualization tools significantly improves the capacity to understand complex systems and identify trends in real time. For instance, in October 2025, internet of things (IoT) Analytics, a Germany-based intelligence company, reported that the connected internet of things (IoT) device base grew to 18.5 billion in 2024, representing a robust 12% year-on-year increase compared to 2023. Thus, the rising demand for IoT devices is a key factor propelling the growth of the data visualization tools market.
Data Visualization Tools Market Segments: A Category-By-Category Overview
The data visualization tools market covered in this report is segmented –
1) By Tool: Standalone, Integrated
2) By Business Function: Marketing And Sales, Human Resources, Operations, Finance
3) By Deployment Mode: On-Premises, Cloud
4) By Organization Size: Large Enterprises, Small And Medium-Sized Enterprises (SMEs)
5) By Vertical: Banking, Financial Services And Insurance (BFSI), Government, Healthcare And Life Sciences, Retail And E-Commerce, Manufacturing, Transportation And Logistics, Telecommunications And Information Technology (IT), Other Verticals
Subsegments:
1) By Standalone: Desktop Applications, Web-Based Solutions
2) By Integrated: Business Intelligence (BI) Platforms, Data Analytics Software, Cloud-Based Integrated Tools
Which Emerging Trends Are Gaining Traction In The Data Visualization Tools Market?
Leading companies operating in the data visualization tools market are focusing on developing advanced software solutions, including AI-driven data visualization systems, to improve decision-making efficiency, enhance operational transparency, and minimize manual analysis. AI-powered data visualization tools are sophisticated software programs that automatically convert intricate supply chain data into intuitive charts and dashboards, thereby simplifying the identification of trends and insights. For example, in September 2024, GrubMarket, a US-based food technology company, introduced GrubAssist Charts, an AI-powered data visualization tool. The GrubAssist Charts feature is a robust component within GrubMarket’s enterprise AI assistant, GrubAssist, crafted to assist food supply chain businesses in visualizing complex data through dynamic, easy-to-understand charts and graphs. By employing natural language commands, users can create tailored visual reports that meet their specific needs, enabling them to track key performance indicators (KPIs), analyze sales patterns, and monitor profitability across vendors and customers. This capability, available on both desktop and mobile devices, streamlines data interpretation for business leaders, analysts, and sales teams, allowing for more informed decision-making at a glance.
Data Visualization Tools Market Key Participants: Prominent Companies At A Glance
Major companies operating in the data visualization tools market are Tableau Software; SAP SE; The International Business Machines Corporation; Oracle Corporation; Microsoft Corporation; Alibaba Group Holding Limited; Alteryx Inc.; Amazon Web Services Inc.; Domo Inc.; Dundas Data Visualization Inc.; GoodData Corporation; Klipfolio Inc.; QlikTech International AB; Salesforce Inc.; SAS Institute Inc.; Sisense Inc.; TIBCO Software Inc.; Zegami Ltd.; Looker Data Sciences Inc.; Google Data Studio; SAP Lumira; MicroStrategy; Yellowfin Business Intelligence; Slemma; Zoho Corporation Pvt. Ltd.; Datawrapper Gmbh; ThoughtSpot Inc.; Periscope Data Inc.
Get Detailed Data Visualization Tools Market Forecasts In The Complete Report:
Top Region In The Data Visualization Tools Market: A Global Perspective
North America was the largest region in the data visualization tools market in 2025. Asia-Pacific is expected to be the fastest-growing region in the forecast period. The regions covered in the data visualization tools market report are Asia-Pacific, South East Asia, Western Europe, Eastern Europe, North America, South America, Middle East, Africa.
Reach Out To Our Team:
The Business Research Company: https://www.thebusinessresearchcompany.com/
Americas: +1 310-496-7795
Asia: +44 7882 955267 & +91 8897263534
Europe: +44 7882 955267
Email us at: marketing@tbrc.info
Follow us on:
LinkedIn: https://in.linkedin.com/company/the-business-research-company
YouTube: https://www.youtube.com/channel/UC24_fI0rV8cR5DxlCpgmyFQ
Global Market Model: https://www.thebusinessresearchcompany.com/global-market-model

Wasay has over a decade of experience in market research, data modelling, and analytics, with prior experience at GlobalData and Decision Tree Consulting Services. At The Business Research Company , he leads research operations across syndicated studies, customized consulting engagements, and the Global Market Model platform. His professional experience includes supporting organizations such as Boston Consulting Group, KPMG, and Ernst & Young. Wasay holds a degree in Electronics and Communications Engineering, postgraduate management qualifications from International Management Institute Belgium and Indian School of Business and Entrepreneurship, and completed the Integrated Program in Business Analytics from Indian Institute of Management Indore.