
Through market attractiveness analysis, total addressable market evaluation, company benchmarking matrices, interactive Excel dashboards, expanded supply chain intelligence, emerging startup coverage, and detailed product insights, The Business Research Company’s 2026 market reports provide more actionable and strategically valuable research.
Data Lineage Visualization For Financial Services Market Expansion Outlook: What Revenue Opportunities Lie Ahead?
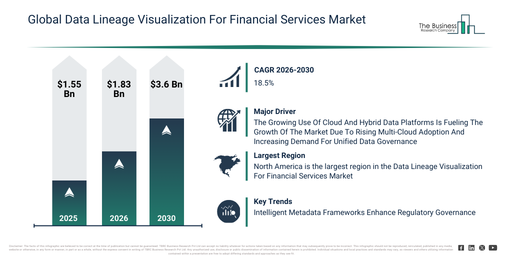
The data lineage visualization market in financial services has experienced rapid expansion in recent years. This market is forecast to expand from $1.55 billion in 2025 to $1.83 billion in 2026, achieving a compound annual growth rate (CAGR) of 18.2%. Key factors contributing to its historical growth include the increasing complexity of financial reporting, the early adoption of visualization tools, heightened regulatory scrutiny, the need for comprehensive audit trails, and the growth in data integration.
The market size for data lineage visualization for financial services is projected to experience swift expansion over the coming years. It is anticipated to grow to $3.6 billion in 2030, exhibiting a compound annual growth rate (CAGR) of 18.5%. This growth in the forecast period can be attributed to factors such as real-time compliance monitoring, AI-driven anomaly detection, integrated risk platforms, digital banking transformation, and stricter reporting mandates. Major trends expected during this period include financial data flow visualization, regulatory audit trail mapping, risk-aware dependency analysis, interactive lineage dashboards, and compliance-focused data transparency.
Download A Free Sample Report For Comprehensive Market Insights:
#Data Lineage Visualization For Financial Services Market Growth Drivers And Industry Catalysts
The expanding adoption of cloud and hybrid data platforms is anticipated to drive the growth of the data lineage visualization for financial services market in the coming years. These platforms are defined as integrated data management environments that combine public cloud, private cloud, and on-premises systems to store, process, and govern data across distributed infrastructures. Their increasing prevalence is due to the rising enterprise demand for scalable, flexible infrastructure supporting distributed workloads, cost optimization, and seamless integration between on-premises and cloud environments. Cloud and hybrid data platforms enable unified tracking, integration, and visualization of data flows across distributed systems, thereby supporting accurate traceability, effective governance, and adherence to regulations in intricate financial data landscapes. For instance, in March 2024, Flexera Software LLC, a US-based computer software company, reported a slight rise in multi-cloud usage, increasing from 87% last year to 89% this year. Hence, the growing use of cloud and hybrid data platforms is a significant driver for the growth of the data lineage visualization for financial services market.
Data Lineage Visualization For Financial Services Market Segment Breakdown: Which Categories Generate The Most Revenue?
The data lineage visualization for financial services market covered in this report is segmented –
1) By Component: Software, Services
2) By Deployment Mode: On-Premises, Cloud
3) By Organization Size: Large Enterprises, Small And Medium-Sized Enterprises
4) By Application: Risk Management, Regulatory Compliance, Data Governance, Fraud Detection, Other Applications
5) By End-User: Banks, Insurance Companies, Asset Management Firms, Other End-Users
Subsegments:
1) By Software: Metadata Management Tools, Data Flow Mapping Tools, Impact Analysis And Dependency Mapping Tools, Audit Trail And Reporting Tools, Integration And Application Programming Interface Connectors
2) By Services: Consulting And Advisory Services, Implementation And Configuration Services, Integration And Migration Services, Training And Knowledge Transfer Services, Support And Maintenance Services
#Data Lineage Visualization For Financial Services Market Trends Influencing Long-Term Demand
Leading companies within the data lineage visualization for financial services market are concentrating on integrating innovative technologies, such as advanced cloud-native lineage automation and intelligent metadata frameworks, to improve scalability, governance, and regulatory compliance throughout complex data environments. These advanced cloud-native lineage automation and intelligent metadata frameworks refer to software architectures designed to automatically capture, analyze, and contextualize data flows across distributed cloud environments, thereby enabling real-time visibility, governance, and intelligent decision-making over enterprise data assets. As an illustration, in December 2024, Amazon Web Services (AWS), a US-based cloud computing platform, launched the general availability of data lineage and visualization capabilities in Amazon DataZone. This enables automated lineage capture across services like AWS Glue and Amazon Redshift, providing unified end-to-end visibility from the data source to its consumption. This improvement enhances compliance, auditability, and data governance for highly regulated industries, including financial services.
Data Lineage Visualization For Financial Services Market Key Players And Strategic Industry Positioning
Major companies operating in the data lineage visualization for financial services market are International Business Machines Corporation, Oracle Corporation, SAP SE, SAS Institute Inc., erwin Inc., Collibra NV, Alation Inc., BigID Inc., Atlan Inc., Ab Initio Software LLC, Acceldata Inc., Immuta Inc., Monte Carlo Data Inc., Solidatus Limited, Unravel Data Inc., Alex Solutions Pty Ltd, Zeenea SAS, Select Star Inc., Infogix Inc., and DataGalaxy SAS.
Access The Complete Data Lineage Visualization For Financial Services Market Report:
Data Lineage Visualization For Financial Services Market Leading Geography: Which Region Generates The Most Revenue?
North America was the largest region in the data lineage visualization for financial services market in 2025. Asia-Pacific is expected to be the fastest-growing region in the forecast period. The regions covered in the data lineage visualization for financial services market report are Asia-Pacific, South East Asia, Western Europe, Eastern Europe, North America, South America, Middle East, Africa.
Get in touch with us:
The Business Research Company: https://www.thebusinessresearchcompany.com/
Americas: +1 310-496-7795
Asia: +44 7882 955267 & +91 8897263534
Europe: +44 7882 955267
Email us at: marketing@tbrc.info
Follow us on:
LinkedIn: https://in.linkedin.com/company/the-business-research-company
YouTube: https://www.youtube.com/channel/UC24_fI0rV8cR5DxlCpgmyFQ
Global Market Model: https://www.thebusinessresearchcompany.com/global-market-model

Wasay has over a decade of experience in market research, data modelling, and analytics, with prior experience at GlobalData and Decision Tree Consulting Services. At The Business Research Company , he leads research operations across syndicated studies, customized consulting engagements, and the Global Market Model platform. His professional experience includes supporting organizations such as Boston Consulting Group, KPMG, and Ernst & Young. Wasay holds a degree in Electronics and Communications Engineering, postgraduate management qualifications from International Management Institute Belgium and Indian School of Business and Entrepreneurship, and completed the Integrated Program in Business Analytics from Indian Institute of Management Indore.