Built to provide research that’s more actionable and strategically valuable, The Business Research Company’s 2026 market reports include market attractiveness analysis, total addressable market sizing, company benchmarking matrices, interactive Excel dashboards, broader supply chain intelligence, emerging startup tracking, and in-depth product insights.
Generative Artificial Intelligence (AI) In Data Visualization Market Growth Potential: How Will Market Size Shift Through 2030?
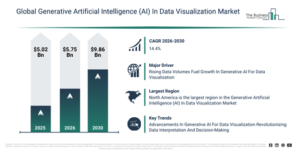
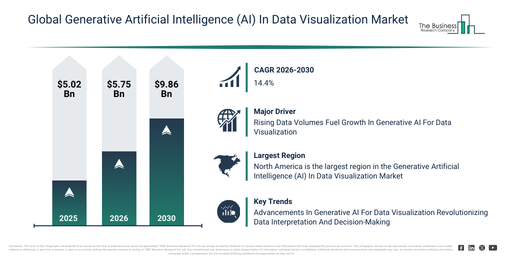
The market for generative artificial intelligence (AI) in data visualization has seen rapid expansion in recent years. This market is set to grow from $5.02 billion in 2025 to $5.75 billion in 2026, at a compound annual growth rate (CAGR) of 14.7%. The historical growth can be attributed to several factors including the expansion of business intelligence tools, increasing volumes of enterprise data, a growing demand for quicker insights, the widespread adoption of visual analytics, and the broader expansion of cloud analytics.
The generative artificial intelligence (AI) in data visualization market size is expected to experience significant growth in the coming years. This market is projected to expand to $9.86 billion in 2030, demonstrating a compound annual growth rate (CAGR) of 14.4%. The expansion during this period is largely driven by the increasing adoption of self-service analytics, the demand for real-time data visualization, the proliferation of AI-powered analytics platforms, the increased utilization of storytelling dashboards, and its broader reach among non-technical users. Key trends anticipated in the forecast period encompass automated insight-driven visual creation, the generation of visualizations from natural language, the development of adaptive and interactive dashboards, AI-generated data storytelling, and the optimization of real-time visualizations.
Get A Free Sample Report With In-Depth Market Insights:
Generative Artificial Intelligence (AI) In Data Visualization Market Demand Drivers Opening New Revenue Streams
The accelerating expansion in data generation is anticipated to advance the generative artificial intelligence in data visualization market moving ahead. This surge in data originates from the broader adoption of digital technologies, a proliferation of IoT devices, and an expanding internet user base. Within this context, generative artificial intelligence in data visualization plays a crucial role in data management by automating insight creation and simplifying complex data for improved comprehension and accessibility. For example, a May 2024 report by Rivery.io, a US-based SaaS company, highlighted the continuous rise in global data volumes, increasing from 149 zettabytes in 2024 to an estimated 181 zettabytes by the close of 2025. Consequently, the growing volume of data being generated is a significant impetus behind the expansion of the generative artificial intelligence in data visualization market.
Generative Artificial Intelligence (AI) In Data Visualization Market Segment Outlook: Which Categories Are Growing Fastest?
The generative artificial intelligence (AI) in data visualization market covered in this report is segmented –
1) By Technology: Generative Adversarial Networks (GANs), Variational Autoencoders (VAEs), Other Technologies
2) By Deployment: Cloud-Based, On-Premises
3) By Application: Exploratory Data Analysis, Business Intelligence, Reporting, Other Applications
4) By Industry Vertical: Information Technology (IT) And Telecom, Healthcare, Finance, Retail, Manufacturing, Other Industry Verticals
Subsegments:
1) By Generative Adversarial Networks (GANs): Image Generation For Data Visualization, Video And Animation Generation, Data Augmentation For Visualization
2) By Variational Autoencoders (VAEs): Dimensionality Reduction For Visualization, Anomaly Detection And Visualization, Data Smoothing And Reconstruction
3) By Other Technologies: Reinforcement Learning For Visualization, Deep Learning Algorithms For Visual Representation, Neural Networks For Graphical Data Interpretation
Generative Artificial Intelligence (AI) In Data Visualization Market Trends Powering Strategic Industry Growth
Leading companies operating in the generative artificial intelligence in data visualization market are creating advanced solutions, such as artificial intelligence-driven graphics, to improve data interpretation, automate visual insights, and refine decision-making processes. Artificial intelligence-driven graphics refer to software that employs AI to automatically generate, enhance, or optimize visual content like charts, graphs, and designs based on data inputs. For instance, in June 2024, Databricks Inc., a US-based software solution company, launched AI/BI, an AI-driven visualization tool. This tool simplifies the visualization process by using AI to automatically create and refine visual representations of complex datasets, thereby making data analysis more efficient and accessible. It supports various applications, including business intelligence, data exploration, predictive analytics, anomaly detection, operational monitoring, customized reporting, and interactive data analysis, all aimed at enhancing decision-making, boosting operational efficiency, and offering deeper insights into data.
Generative Artificial Intelligence (AI) In Data Visualization Market Leading Companies And Competitive Benchmarking
Major companies operating in the generative artificial intelligence (AI) in data visualization market are Alphabet Inc., Microsoft Corporation, International Business Machines Corporation, Oracle Corporation, NVIDIA Corporation, Salesforce Inc., Qlik Technologies AB, MicroStrategy Incorporated, Domo Inc., Sisense Inc., ThoughtSpot Inc., Yellowfin BI, Plotly, Klipfolio Inc., ClicData Inc., Metabase Inc., Tableau, Zoho Analytics, Powerdrill AI, Sigma Computing, Julius AI, Polymer, Akkio, Visme, Graphy, Querio AI, Knowi, AILYZE, VizGPT
View The Full Generative Artificial Intelligence (AI) In Data Visualization Market Report:
Generative Artificial Intelligence (AI) In Data Visualization Market Geographic Analysis: Where Is Demand Rising Fastest?
North America was the largest region in the generative artificial intelligence in data visualization market in 2025. The regions covered in the generative artificial intelligence (AI) in data visualization market report are Asia-Pacific, South East Asia, Western Europe, Eastern Europe, North America, South America, Middle East, Africa.
Reach Out To Our Team:
The Business Research Company: https://www.thebusinessresearchcompany.com/
Americas: +1 310-496-7795
Asia: +44 7882 955267 & +91 8897263534
Europe: +44 7882 955267
Email us at: marketing@tbrc.info
Follow us on:
LinkedIn: https://in.linkedin.com/company/the-business-research-company
YouTube: https://www.youtube.com/channel/UC24_fI0rV8cR5DxlCpgmyFQ
Global Market Model: https://www.thebusinessresearchcompany.com/global-market-model

Wasay has over a decade of experience in market research, data modelling, and analytics, with prior experience at GlobalData and Decision Tree Consulting Services. At The Business Research Company , he leads research operations across syndicated studies, customized consulting engagements, and the Global Market Model platform. His professional experience includes supporting organizations such as Boston Consulting Group, KPMG, and Ernst & Young. Wasay holds a degree in Electronics and Communications Engineering, postgraduate management qualifications from International Management Institute Belgium and Indian School of Business and Entrepreneurship, and completed the Integrated Program in Business Analytics from Indian Institute of Management Indore.